
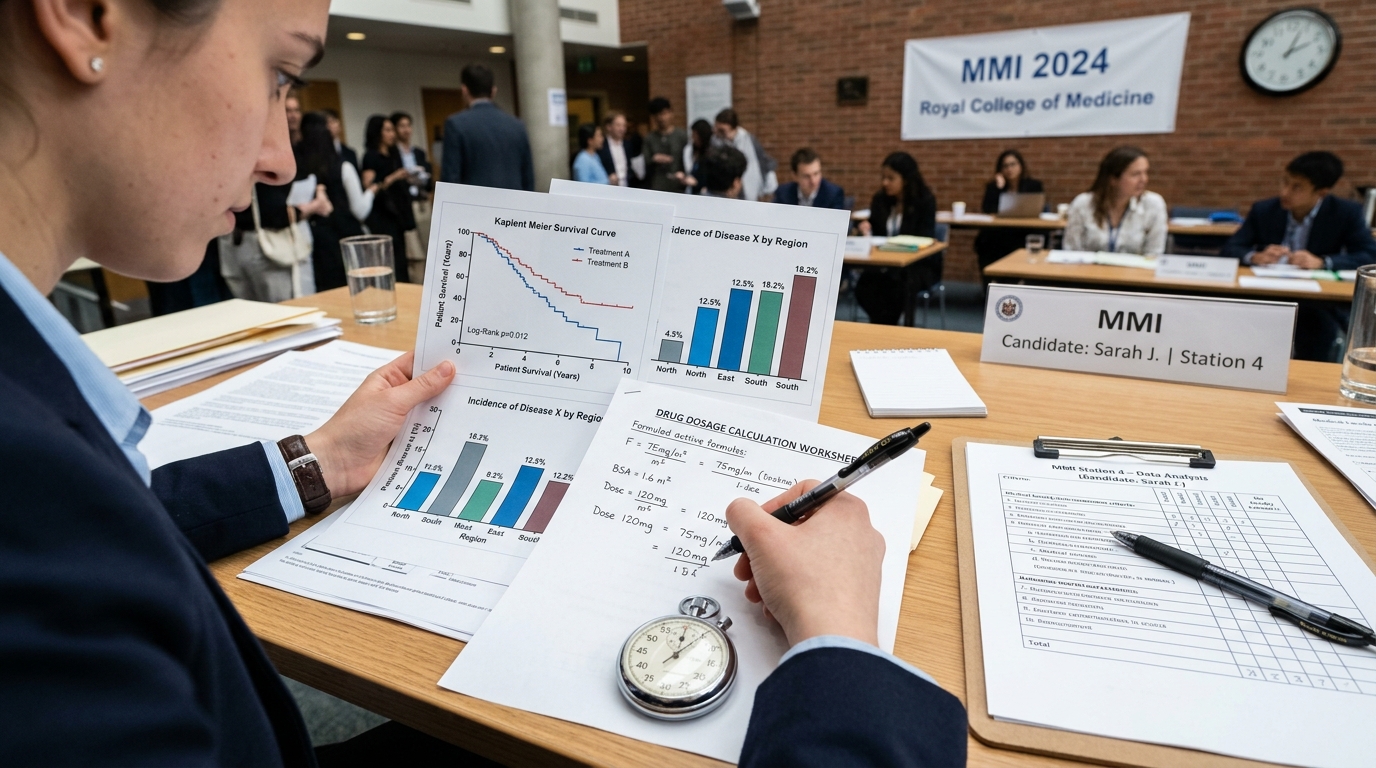

MMI Medical Numeracy & Data Interpretation Command Center
Numeracy Mentorship
1-on-1 Data Station Coaching
Master rapid mental drug calculations, survival curve interpretations, and statistical risk communication with clinical doctors.
Book Numeracy CoachingAI Numeracy Engine
AI Interview Coach
Practice timed data interpretation stations with dynamic graph generation, dosage checks, and step-by-step worked solutions.
Practice Data StationsMaster Workbook
Download Free PDF Dossier
Download our complete 45-page practice workbook featuring 25 worked exercises, formula cheat sheets, and common mathematical traps.
1. Executive Overview: Why UK Medical Schools Test Data Interpretation and Numeracy
In clinical medicine, numbers are not abstract academic symbols; they are matters of life and death. An incorrectly placed decimal point in a pediatric antibiotic dosage calculation can trigger fatal renal failure. Misinterpreting an epidemiological survival curve can lead to prescribing an ineffective cancer treatment. Failing to understand the mathematical difference between absolute risk and relative risk can terrify a patient into refusing a life-saving surgical procedure.
For this reason, numerous UK medical schools—including the University of Cambridge, University of Dundee, University of Edinburgh, Queen's University Belfast, St George's University of London, and Sunderland—regularly integrate Data Interpretation and Medical Numeracy stations into their Multiple Mini Interview circuits.
Crucially, admissions assessors are not testing advanced collegiate calculus or abstract linear algebra. The mathematics required is grounded in GCSE-level arithmetic: ratios, percentages, fractions, unit conversions, and chart reading. However, what makes these stations intensely challenging is the environment: you must perform calculations under strict 7-minute time pressure, without a scientific calculator, explain your reasoning aloud, and interpret what the numbers mean for a human patient. This comprehensive guide provides step-by-step worked exercises, essential clinical formulas, and expert techniques to excel in MMI data stations.
2. Which UK Medical Schools Include Data Interpretation and Numeracy Stations?
Fast-Track Your College & Career Strategy
Get immediate, personalized AI insights tailored to your grade, strengths, and dream universities — 100% free with instant reports.
Know Your Personality Type for Free
Take our 18-question AI psychometric test to uncover your cognitive archetype, hidden learning superpowers, and ideal university courses.
Personalized Career & University EduPath
Build a step-by-step Grade 8–12 admissions blueprint with AI-matched target universities, exam schedules, and extracurricular profiles.
Before beginning your preparation, it is essential to understand institutional variations across the UK:
Institutions with Dedicated Numeracy Stations: Medical schools such as Dundee, St George's, Queen's Belfast, and Sunderland frequently feature explicit, standalone numeracy or calculation stations where candidates are given a scenario with pen, paper, and timed arithmetic tasks.
Institutions with Integrated Data Interpretation Stations: Universities such as Cambridge, Edinburgh, Bristol, and Sheffield often embed charts, Kaplan-Meier survival curves, or clinical trial tables into ethical or current affairs stations. Candidates are asked to evaluate scientific data, critique study limitations, and explain findings to a patient.
Important Note on Specificity: Not every UK medical school includes a standalone calculation station; some focus entirely on ethical dilemmas and role-play. Always verify the interview format of your specific shortlisted universities, but remember that data literacy is a universal clinical competency.
| Clinical Metric / Calculation | Mathematical Formula | Units & Conversion Rule | Clinical Application Example |
|---|---|---|---|
| Total Daily Pediatric Dose | Weight (kg) x Dosage (mg/kg) | Convert weight to kg; dose in mg | Calculating amoxicillin for 20kg child |
| Liquid Volume to Administer | (Prescribed mg / Available mg) x Vol (mL) | Ensure drug masses share same units | Measuring 200mg from 125mg/5mL bottle |
| IV Drip Rate (Gravity) | (Volume mL x Drop Factor) / Minutes | Hours multiplied by 60; whole drops | Infusing 1L saline with 20 drop/mL set |
| Absolute Risk Reduction (ARR) | Control Risk - Intervention Risk | Expressed as percentage or decimal | Statin reducing stroke from 4% to 2% |
| Relative Risk Reduction (RRR) | ARR / Control Risk | Expressed as percentage | 50% relative reduction from 4% baseline |
| Number Needed to Treat (NNT) | 1 / ARR | Always round up to nearest integer | Treating 50 patients to prevent 1 stroke |
| Body Mass Index (BMI) | Weight (kg) / [Height (m)]^2 | Height must be converted to meters | Evaluating 72kg patient with 1.80m height |
3. The 4-Step Clinical Data Interpretation Framework: O-A-I-C
When presented with a complex graph, table, or epidemiological chart, structure your verbal response using the OAIC framework:
O - Orientation (First 30 seconds): Read the title and look at both axes. Identify the variables, units of measurement, sample size (n), and time period. State this clearly to the examiner: 'This is a line graph illustrating 5-year survival rates across three patient cohorts from 2015 to 2024.'
A - Analysis of Trends (Minutes 1 to 3): Identify the primary macro-trend. Are values rising, falling, or plateauing? Where is the greatest inflection point or rate of change? Quote specific data points: 'Group A demonstrated a 40% reduction in mortality between Year 1 and Year 3.'
I - Interpretation & Clinical Significance (Minutes 3 to 5): What does this mean for clinical practice? Which treatment was superior? Are the differences clinically meaningful or just numerically visible?
C - Critique & Limitations (Minutes 5 to 7): Scrutinize the data's credibility: Is the sample size small? Was there selection bias? Is correlation being confused with causation? Are confounding variables (age, smoking status) accounted for?
4. Foundational Clinical Calculations: Unit Conversions and Common Pitfalls
Unit conversions are the primary trap where candidates stumble under stress:
Metric Mass Conversions: 1 kilogram (kg) = 1,000 grams (g); 1 gram (g) = 1,000 milligrams (mg); 1 milligram (mg) = 1,000 micrograms (mcg or ug); 1 microgram (mcg) = 1,000 nanograms (ng).
Metric Volume Conversions: 1 liter (L) = 1,000 milliliters (mL); 1 milliliter (mL) = 1 cubic centimeter (cc).
Time Conversions: 1 hour = 60 minutes = 3,600 seconds.
The Decimal Trap: When converting from milligrams to micrograms, multiply by 1,000 (move the decimal point 3 places to the right). When converting micrograms to milligrams, divide by 1,000 (move decimal 3 places to the left). Practice these until they are second nature.
5. Drug Dosage Calculations by Body Weight (mg/kg/day)
Pediatric and specialized adult medications are virtually always prescribed based on the patient's exact body weight:
The Master Formula: Total Daily Dose = Patient Weight (in kg) x Prescribed Dose (in mg/kg).
Dose Per Administration: Individual Dose = Total Daily Dose / Number of Doses per Day.
Worked Example 1:
Scenario: A 6-year-old child weighing 20 kg requires amoxicillin at a dose of 30 mg/kg/day, to be divided into 3 equal doses taken every 8 hours. What is the single dose the child should receive?
Step 1: Calculate Total Daily Dose = 20 kg x 30 mg/kg/day = 600 mg per day.
Step 2: Calculate Single Dose = 600 mg / 3 doses = 200 mg per dose.
Step 3: Verification: Check units. 200 mg three times daily equals 600 mg total daily. The answer is clean and safe.
6. Liquid Medication and Suspension Volume Calculations (C1V1 = C2V2)
In pediatric medicine, drugs are supplied as liquid suspensions (e.g., 250 mg in 5 mL):
The Formula: Volume to Administer (mL) = (Prescribed Dose in mg / Available Concentration in mg) x Unit Volume (mL).
Worked Example 2:
Scenario: Following Example 1, the child requires 200 mg of amoxicillin per dose. The hospital pharmacy provides an oral suspension with a concentration of 125 mg in 5 mL. What volume in milliliters should the mother administer?
Step 1: Identify components: Prescribed Dose = 200 mg; Available Dose = 125 mg; Unit Volume = 5 mL.
Step 2: Set up proportion: (200 / 125) x 5 mL = (8 / 5) x 5 mL = 8 mL.
Step 3: Clinical Sanity Check: 5 mL gives 125 mg. 10 mL gives 250 mg. Since 200 mg is between 125 mg and 250 mg, 8 mL is logical and correct.
7. IV Infusion and Drip Rate Calculations (Drops per Minute)
Calculating intravenous fluid infusion rates using standard gravity drip sets:
The Formula: Drip Rate (drops/min) = (Total Infusion Volume in mL x Drop Factor in drops/mL) / Total Time in Minutes.
Worked Example 3:
Scenario: A dehydrated adult patient requires 1,000 mL of 0.9% Normal Saline infused intravenously over 8 hours. The IV administration set has a drop factor of 20 drops/mL. What should the drip rate be set to in drops per minute?
Step 1: Convert time into minutes: 8 hours x 60 minutes = 480 minutes.
Step 2: Calculate total drops: 1,000 mL x 20 drops/mL = 20,000 drops.
Step 3: Divide by total minutes: 20,000 drops / 480 minutes = 2,000 / 48 = 41.67 drops/min.
Step 4: Clinical Rounding: You cannot deliver a fraction of a drop. Round to the nearest whole integer: 42 drops per minute.
8. Absolute Risk (AR) vs Relative Risk (RR): The Communication Masterclass
Understanding risk statistics is the ultimate differentiator in medical school interviews:
Definitions:
Absolute Risk (AR): The actual baseline probability that an individual will develop a condition or experience an adverse event within a specific time.
Relative Risk (RR): The ratio comparing the risk of an event in an exposed group to the risk in an unexposed group.
The Classic Misleading Headline: A newspaper announces: 'New wonder drug cuts heart attack risk by 50%!'
The Reality Behind the Numbers: If the baseline risk without the drug is 2 in 1,000 patients (0.2%), and with the drug it drops to 1 in 1,000 patients (0.1%), the Relative Risk Reduction is indeed 50%. However, the Absolute Risk Reduction (ARR) is only 0.1% (a 1 in 1,000 benefit).
Communicating to Patients: A skilled doctor never quotes relative risk alone because it exaggerates benefits and terrifies patients regarding side effects. Explain risk using natural frequencies (e.g., 'Out of 1,000 people who take this pill, 1 will avoid a heart attack, while 999 will experience no difference').
9. Number Needed to Treat (NNT) and Number Needed to Harm (NNH)
Clinical metrics that measure the real-world therapeutic efficiency of medical interventions:
Number Needed to Treat (NNT): The number of patients who need to receive a specific treatment for one additional patient to benefit.
The Formula: NNT = 1 / Absolute Risk Reduction (ARR).
Worked Example 4: If an antihypertensive medication reduces stroke incidence from 5% (0.05) to 3% (0.03):
Step 1: ARR = 0.05 - 0.03 = 0.02 (2%).
Step 2: NNT = 1 / 0.02 = 50. This means you must treat 50 hypertensive patients with this pill for a year to prevent one single stroke.
Number Needed to Harm (NNH): The number of patients treated before one patient experiences an adverse drug reaction. An ideal drug has a very low NNT (e.g., 5) and a very high NNH (e.g., 5,000).
10. Sensitivity, Specificity, and Positive Predictive Value (PPV)
Evaluating diagnostic screening tests (e.g., rapid COVID lateral flow, mammography, prostate PSA):
Sensitivity: The ability of a test to correctly identify individuals who HAVE the disease (True Positive Rate = True Positives / [True Positives + False Negatives]). A test with high sensitivity rarely misses disease (rules out disease: SnNOut).
Specificity: The ability of a test to correctly identify individuals who DO NOT have the disease (True Negative Rate = True Negatives / [True Negatives + False Positives]). A test with high specificity rarely gives a false alarm (rules in disease: SpPIn).
Positive Predictive Value (PPV): The probability that a patient with a positive test result actually has the disease. Critical Insight: PPV depends heavily on the prevalence of the disease in the population. In a rare disease, even a 99% accurate test will yield more false positives than true positives.
11. Interpreting Kaplan-Meier Survival Curves in Oncology Trials
Kaplan-Meier curves are the standard graphical representation of clinical survival data:
How to Read the Curve: The vertical y-axis represents the probability of survival (from 1.0 or 100% down to 0). The horizontal x-axis represents time elapsed (months or years).
The Stepped Profile: The curve drops in steps whenever an event (death or disease progression) occurs in the study cohort.
Censored Data: Small vertical tick marks on the curve represent 'censored' patients—individuals who withdrew from the study, moved away, or were lost to follow-up.
Evaluating Efficacy: Look at the gap between the intervention curve (Drug X) and the control curve (Placebo). If the gap widens and remains separated over time, the drug demonstrates meaningful survival prolongation. Look for the p-value (p < 0.05 indicates statistical significance).
12. Interpreting Forest Plots in Systematic Reviews and Meta-Analyses
Forest plots summarize findings from multiple randomized controlled trials into a single meta-analysis:
The Vertical Line of No Effect: A vertical line representing 1.0 (for Odds Ratios / Relative Risk) or 0.0 (for mean differences).
Horizontal Lines & Boxes: Each individual trial is shown as a horizontal line representing its 95% Confidence Interval (CI). The size of the box reflects the trial's statistical weight (sample size).
The Diamond (Overall Pooled Result): The diamond at the bottom represents the synthesized pooled result. If the diamond does NOT touch or cross the vertical line of no effect, the overall intervention is statistically significant.
13. Identifying Statistical Bias: Selection Bias, Recall Bias, and Confounding
Admissions tutors will ask you to critique flawed datasets:
Selection Bias: Occurs when the study cohort is not representative of the real-world target population (e.g., testing an arthritis drug only on fit, healthy 25-year-old males in a university lab).
Recall Bias: Common in retrospective case-control studies where patients are asked to remember past behaviors (e.g., asking mothers of children with birth defects to remember what they ate 5 years ago).
Confounding Variables: An unmeasured third variable that correlates with both the exposure and the outcome, creating a false impression of causality (e.g., claiming coffee drinking causes heart attacks, when coffee drinkers in the study cohort also smoked cigarettes at triple the rate).
14. Correlation vs Causation: The Ice Cream and Drowning Trap
The cardinal rule of scientific statistics:
The Concept: Just because two variables move together over time (correlation) does NOT mean one variable causes the other (causation).
The Classic Example: Ice cream sales and drowning rates correlate strongly. Eating ice cream does not cause drowning; hot summer weather (the confounding variable) causes people both to buy ice cream and to swim in open water.
Application in MMIs: When shown a graph demonstrating that a dietary supplement correlates with lower dementia rates, remind the interviewer that without randomized controlled double-blind trials, correlation could merely reflect higher wealth or healthier lifestyles among supplement purchasers.
15. Body Mass Index (BMI) and Metric Medical Formula Calculations
Calculating physiological and anthropometric clinical indicators:
The Formula: BMI = Weight (in kg) / [Height (in meters)]^2.
Worked Example 5:
Scenario: A patient weighs 72 kg and has a measured height of 1.80 meters. Calculate their BMI and categorize their weight status.
Step 1: Calculate height squared: 1.8 x 1.8 = 3.24 m^2.
Step 2: Divide weight by height squared: 72 / 3.24 = 22.22 kg/m^2.
Step 3: Clinical Categorization: Underweight (< 18.5); Normal healthy weight (18.5 - 24.9); Overweight (25.0 - 29.9); Obese (Class 1: 30.0 - 34.9). The patient is in the healthy weight range.
16. Exercise 1: Percentage Changes in NHS A&E 4-Hour Waiting Standard
Practice Problem: In an acute NHS hospital Trust in January, 12,000 patients attended the Emergency Department, and 8,400 were admitted, transferred, or discharged within the statutory 4-hour target. In February, following clinical triage reforms, 10,000 patients attended, and 8,000 met the 4-hour target.
Question: Calculate the compliance percentage for January and February. What was the percentage-point improvement?
Worked Solution:
Step 1 (January Compliance): (8,400 / 12,000) x 100 = (84 / 120) x 100 = 70.0%.
Step 2 (February Compliance): (8,000 / 10,000) x 100 = 80.0%.
Step 3 (Comparison): Compliance improved by 10 percentage points (from 70% to 80%). The relative percentage improvement is (10 / 70) x 100 = 14.28%.
17. Exercise 2: Pediatric Paracetamol Suspension Weight-Based Dosing
Practice Problem: A 4-year-old child weighing 16 kg presents with high fever. The recommended dose of paracetamol is 15 mg/kg per dose, administered every 4 to 6 hours as needed (maximum 4 doses in 24 hours). The medicine bottle provides infant suspension containing 120 mg of paracetamol in every 5 mL.
Question: How many milliliters of suspension should be administered for a single dose?
Worked Solution:
Step 1: Calculate required dose in mg: 16 kg x 15 mg/kg = 240 mg.
Step 2: Calculate volume in mL: Concentration is 120 mg in 5 mL. Since 240 mg is exactly double 120 mg (240 / 120 = 2), the volume is 2 x 5 mL = 10 mL.
Step 3: Answer: Administer exactly 10 mL.
18. Exercise 3: Calculating Absolute vs Relative Risk in Cardiovascular Trials
Practice Problem: In a 5-year randomized clinical trial of 10,000 patients with high cholesterol: 5,000 received a new statin drug, and 100 suffered a stroke (2.0%); 5,000 received a placebo pill, and 200 suffered a stroke (4.0%).
Question: Calculate the Absolute Risk Reduction (ARR), the Relative Risk Reduction (RRR), and the Number Needed to Treat (NNT).
Worked Solution:
Step 1: ARR = Baseline Risk (0.04) - Treatment Risk (0.02) = 0.02 (or 2.0%).
Step 2: RRR = ARR / Baseline Risk = 0.02 / 0.04 = 0.50 (or 50.0%).
Step 3: NNT = 1 / ARR = 1 / 0.02 = 50.
Interpretation: You must treat 50 patients with this statin for 5 years to prevent one stroke.
19. Exercise 4: IV Potassium Chloride Dilution and Infusion Rate
Practice Problem: A patient with severe hypokalemia requires 40 mmol of Potassium Chloride (KCl) infused intravenously in 500 mL of 0.9% Normal Saline over 4 hours. The safe maximum infusion rate of IV potassium is 10 mmol per hour.
Question: Is this infusion order clinically safe? What is the fluid infusion rate in mL per hour?
Worked Solution:
Step 1: Check potassium rate: 40 mmol over 4 hours = 40 / 4 = 10 mmol/hour. This matches the safe ceiling of 10 mmol/hour.
Step 2: Calculate fluid infusion rate: 500 mL over 4 hours = 500 / 4 = 125 mL/hour.
Step 3: Conclusion: The prescription is clinically safe and the infusion pump should be programmed to 125 mL/hour.
20. Exercise 5: Critical Appraisal of a Misleading Health Survey
Practice Problem: An online poll on a fitness magazine website surveyed 500 self-selected subscribers and found that 85% reported taking daily vitamin D supplements cured their winter fatigue.
Question: As an applicant, critique the methodological validity of this claim.
Worked Critique: 1) Severe Selection Bias: The sample consists of self-selected fitness enthusiasts, not a randomized representative general population; 2) No Control Group: Without a double-blind placebo group, the observed effect could be entirely psychological (the placebo effect); 3) Self-Reporting Subjectivity: 'Fatigue' is a subjective symptom influenced by sleep, diet, and cognitive expectation; 4) Commercial Conflict of Interest: Fitness magazines frequently carry advertisements for supplement manufacturers.
21. Master Reference Table: Key Clinical Formulas and Mathematical Shortcuts
The following reference matrix summarizes the core formulas every medical applicant should memorize for MMI numeracy stations:
22. Mental Arithmetic Strategies Under Timed Stress: Eliminating Scratchpad Panic
Under 7-minute pressure, mental arithmetic breakdowns happen when candidates try to do long division in their heads:
The Fraction Simplification Trick: Always reduce numbers to their simplest fractional ratios before multiplying (e.g., 200/125 = 8/5; multiplying by 8/5 is vastly easier than dividing 200 by 125).
The 10% Benchmark Method: To calculate 15% of a number: find 10% (move decimal 1 place left), take half of that to find 5%, and add them together.
Sanity Checking Bounds: Before stating an answer, establish upper and lower bounds: 'My answer must be between 10 mL and 20 mL.' If your calculated result is 150 mL, you immediately catch your decimal mistake before the examiner does.
23. How to Speak Aloud While Calculating: Demonstrating Your Working Memory
Examiners do not want total silence for 5 minutes followed by a single number. They grade your methodology:
Verbalize Every Calculation Step: 'First, I am identifying the patient's weight, which is 20 kg. Next, I multiply this by the daily dosage of 30 mg/kg, giving a total daily requirement of 600 mg. Since this is divided into three daily doses, I divide 600 by 3, arriving at 200 mg per administration.'
Why This Protects You: If you make a minor mental arithmetic slip at the very end, examiners can award you 90% of the marks for flawless clinical methodology.
24. Translating Complex Data into Compassionate Patient Explanations
In many MMI stations, Step 1 is calculating the numbers; Step 2 is turning to an actor portraying a patient to explain what the numbers mean:
Avoid Jargon: Never say 'Your relative risk reduction is 33% with an NNT of 40.'
Use Natural Frequencies: Say: 'What this clinical study shows is that if we gave this medicine to 40 people with your condition, 1 person would avoid a stroke who would otherwise have had one, while the other 39 would experience no difference. Let us discuss what that means for your daily life.'
25. Common Mistakes Made in MMI Numeracy Stations
Examiners report that candidates fail numeracy stations due to these preventable mistakes:
1. Forgetting to State the Units: Writing '45' instead of '45 mL/hour' or '45 mg'. In pharmacology, a number without a unit is clinically meaningless.
2. Neglecting Rounding Rules: Leaving decimal drip rates (e.g., '41.67 drops/min') when real clinical equipment only delivers whole drops.
3. Panicking After an Arithmetic Error: If you realize you made a mistake, do not freeze; smile, state clearly: 'Excuse me, I notice a calculation error in my second step, let me correct that,' and recalculate calmly.
26. How Medical Schools Use Numeracy to Evaluate Stress Inoculation
Numeracy stations are deliberately placed between emotionally taxing stations (like breaking bad news):
Cognitive Task Switching: Medical schools want to observe whether you can transition seamlessly from high-empathy communication to rigorous analytical computation, mimicking the real-life demands of a junior hospital doctor on call.
27. The Role of Calculators: What UK Medical School Rules Actually Permit
Every medical school sets its own station equipment rules:
No-Calculator Stations: Universities such as Dundee and Queen's Belfast historically require non-calculator mental and pen-and-paper arithmetic.
Basic Calculator Stations: Some universities provide a standard, non-scientific 4-function desk calculator. However, relying on a calculator without mental sanity checks is dangerous if you mis-key a number.
28. Case Study: A Cambridge Medicine Data Station Deconstructed (Full Marks)
At Cambridge, a candidate was handed a graph showing incidence of bowel cancer plotted against red meat consumption:
How the Candidate Scored Top Marks: She immediately established that this was an ecological observational study, pointed out the potential confounding influence of low dietary fiber and higher alcohol consumption among heavy red meat eaters, and cautioned that ecological correlation does not establish individual biological causation without randomized dietary intervention trials.
29. Case Study: Recovering from a Calculation Error at Dundee MMI
At the University of Dundee numeracy station, a candidate calculated an infusion rate of 12.5 mL/min instead of 1.25 mL/min:
The Recovery: She stopped, looked at the total bag volume (500 mL), and said: 'At 12.5 mL per minute, this entire 500 mL bag would empty in 40 minutes, which contradicts the 6-hour infusion order. I have placed a decimal point incorrectly.' She recalibrated to 1.25 mL/min. The examiner praised her clinical sanity check and awarded full marks.
30. Checklist: What to Write on Your Scratchpad the Second You Sit Down
1. Write down: 1 kg = 1,000 g = 1,000,000 mg = 1,000,000,000 mcg.
2. Write down: 1 hour = 60 minutes.
3. Write down: Desired / Have x Volume (Dosage formula).
4. Write down: NNT = 1 / ARR.
5. Remind yourself to speak every calculation step aloud.
31. EduQuest Numeracy Lab: Timed Clinical Math & Data Interpretation Drills
Mastering medical numeracy requires structured, timed muscle memory:
EduQuest provides specialized clinical numeracy training led by medical doctors and biostatisticians.
Our students complete over 100 timed calculation drills, practice deconstructing Kaplan-Meier and Forest plots, and learn the verbal signposting required to score maximum points under pressure.
32. Strategic Conclusion & Next Steps: Mastering the Language of Medical Science
Data interpretation and numeracy are not barriers designed to trip you up; they are the analytical tools of safe, compassionate, evidence-based clinical medicine.
By mastering foundational unit conversions, speaking your mathematical methodology aloud, and translating statistics into human patient narratives, you conquer the numeracy station with total confidence.
Connect with EduQuest today to practice live MMI data interpretation stations and secure your medical school offer.
33. Frequently Asked Questions: MMI Data Interpretation and Numeracy Stations
Comprehensive answers to common questions about calculators, drug dosage math, and statistical chart analysis in UK medical interviews.
Sharpen Your Medical Numeracy with EduQuest AI Intelligence Suite
Simulate timed MMI calculation stations, evaluate clinical chart interpretations, and receive instant feedback on drug math accuracy.
AI MMI & Interview Coach
Simulate live timed MMI data interpretation and dosage calculation stations with dynamic clinical case generators.
- ✓ Timed Drug Dosage Drills
- ✓ Kaplan-Meier Curve Explanations
- ✓ Real-Time Mental Math Verification
Narrative Intelligence Engine
Scans your UCAS personal statement and medical reflective essays against successful UK medical school applications.
- ✓ Work Experience Reflection Check
- ✓ Scientific Rigor Scoring
- ✓ GMC Values Alignment
EduPath Admissions Profiler
Calculates your interview invitation probability across all 42 UK medical schools based on your UCAT and academic profile.
- ✓ UCAT Cutoff Prediction
- ✓ Strategic Medical School Shortlisting
- ✓ International Quota Modeling
Career Cluster Assessment
Aligns your clinical interests with medical and surgical specialties across the NHS and international healthcare markets.
- ✓ Clinical Specialty Diagnostic
- ✓ Surgical vs Medical Personality Mapping
- ✓ NHS Training Pathway Index
Do all UK medical schools have numeracy stations in their MMI?
No. Not every medical school includes a standalone calculation station. However, universities such as Dundee, St George's, Queen's Belfast, and Sunderland regularly test numeracy, while Cambridge, Edinburgh, and Bristol embed chart and data interpretation into wider stations.
Can I use a calculator in MMI numeracy stations?
It depends on the university. Some medical schools allow basic 4-function desk calculators, while others strictly mandate mental and pen-and-paper arithmetic. Always practice mental arithmetic shortcuts to build resilience under pressure.
What is the difference between Absolute Risk and Relative Risk?
Absolute risk is the actual baseline probability of an event happening. Relative risk is the ratio comparing risk between two groups. Pharmaceutical marketing often cites relative risk (e.g., '50% reduction') to make benefits look larger than a modest absolute risk reduction (e.g., from 2% down to 1%).
What happens if I make a calculation mistake in the station?
Do not panic. If you realize your error, calmly say aloud: 'I notice a calculation error in my step, let me correct that,' and recalculate. Examiners award substantial marks for methodology, unit verification, and clinical sanity checks even if minor mental arithmetic slips occur.
What is Number Needed to Treat (NNT)?
NNT is the number of patients who need to receive a treatment for one additional patient to benefit. It is calculated as 1 divided by the Absolute Risk Reduction (ARR). A lower NNT indicates a more potent, efficient clinical treatment.
Download the MMI Data Interpretation & Medical Numeracy Practice Workbook (PDF)
Get our full 45-page practice workbook featuring 25 worked exercises with step-by-step solutions, drug dosage formulas, and statistical chart interpretation guides.